

A writer's guide to Google Analytics 4
The Google Analytics you've used for years is going away. Here's how to adapt to the new version.
It’s been the constant companion of bloggers for over a decade and a half, the analytics tool from Google that told you how many people visited your site.
And now it’s going away.
Not Google Analytics itself, that is, but Google Analytics 3, the “Universal Analytics” version of Google Analytics you've used since it launched in 2012, that's what's going away. The new Google Analytics 4 is built for “App + Web” tracking, closer to tools like Amplitude or Mixpanel than its predecessor. It's better at tracking conversions, worse at letting you quickly see how many people are reading your articles.
You’ve got to switch—to Google Analytics 4, or something else, by July 1, 2023. After that, the Google Analytics you’re already using will go away.
So here's a crash course into Google Analytics 4 for writers, with how to replace the things you likely checked the most in the old Google Analytics with their new GA4 counterparts.
How to replace Google Analytics 3 features in Google Analytics 4
- A Google Analytics Dictionary
- The Dashboard
- Realtime Audience
- Site Content → All Pages
- Bounce Rate
- Referrals
- Search Queries
But first, a few downsides.
Google Analytics 4 came out in late 2020. Upgrading's easy; you can follow Google's suggested steps in your existing Analytics to activate a new GA4 property and start tracking data alongside your existing Google Analytics. But switching entirely was a hard sell switching before it was required.
That’s because of the first, most surprising, nearly deal-breaking thing about Google Analytics 4: You cannot bring your existing Google Analytics data into Google Analytics 4.
You don’t upgrade to use the new version. Instead, you create a new Google Analytics 4 property and track your old stats in the old interface while checking your newer stats in your new GA4 interface.
“You'll be able to see your Universal Analytics reports for a period of time after July 1, 2023,” promises Google in its Analytics Docs. “However, new data will only flow into Google Analytics 4 properties.”
Maybe Google will offer a last-minute reprieve, or build a way to import your older stats into the new Google Analytics (something that seems unlikely, since nearly every bit of data tracked has changed). But for now, you’re both going to need to start using Google Analytics 4—the sooner, the better, to have as much data in one place as possible—and you’re going to need to export and save your older Google Analytics 3 data just in case it really does go away.
Then, the second surprising thing: Everything has changed. Everything. Every report I used to check, including my most-viewed Behavior → Site Content → All Pages, has moved somewhere new.
Thus this guide. Here’s how to find all the things that I used most in Google Docs as a writer tracking blog stats, with tips on how to bring back your favorite Google Analytics features in the new version:
A Google Analytics Dictionary
If you’ve used Google Analytics for long enough, you’ll have certain terms you look for by default. You’ll also likely be used to things changing, as Google had already started replacing the idea of unique pageviews with users. But this many changes at once can be disorientating.
- Google Analytics—the version you’ve been using up until now—is officially called Universal Analytics, while the new version is called just Google Analytics or Google Analytics 4. If your site’s tracking code starts with
UA-then you’re using the older Universal Analytics; if your tracking code instead starts with justG-then you’re using the new version. - Pageviews are now called Views. According to Google, Views are “The number of app screens or web pages your users saw. Repeated views of a single screen or page are counted.”
- Unique Pageviews are replaced by Users, or individual people who saw that page.
- Average time on Page has been replaced by Average engagement time that shows, according to Google, “the average length of time that the app was in the foreground, or the website had focus in the browser.” Just having your page open in a background tab doesn’t count; Google’s now focused on how long they were reading (which is good).
- Bounce Rate is gone, with a new Engagement Rate for something similar that tracks how many people were engaged with your site, rather than how many quickly left. You can get something approaching a bounce rate by subtracting your Engaged Rate from 100%, but it’ll always look better than your older Bounce Rate did as just staying on one page for a while counts as engaged. See more about Engagement Rate below in the Bounce Rate section.
With those new names in mind, here’s how to find them and make the most of them in the new Google Analytics.
The Dashboard
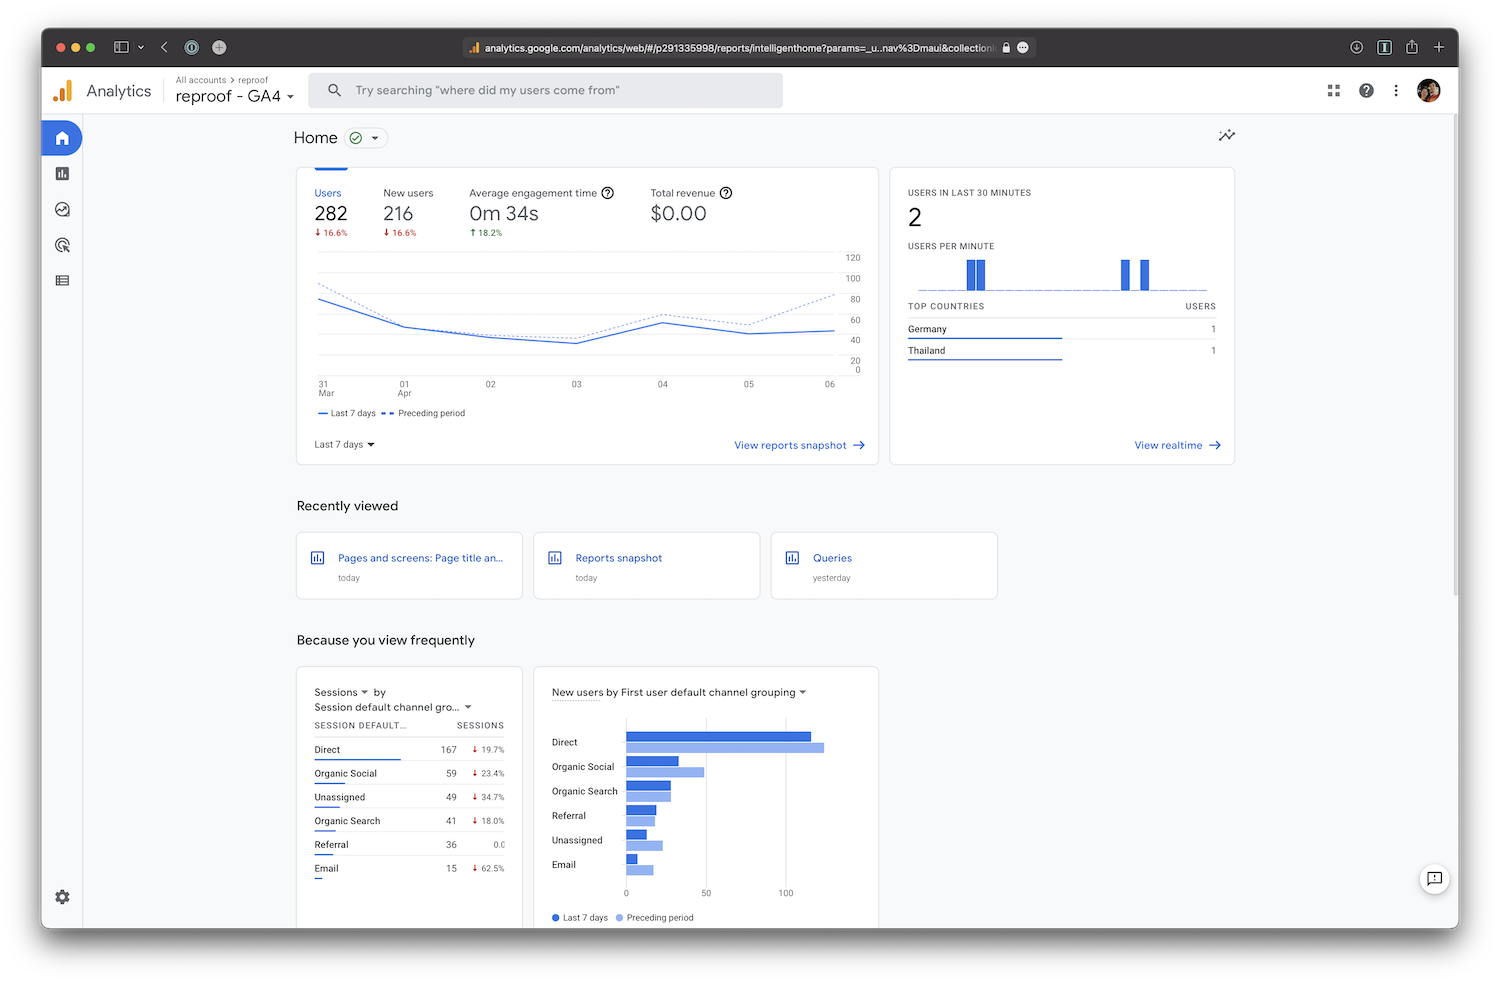
The changes start when you first log into Google Analytics. The new Google Analytics dashboard feels sparse at first, though over time will automatically show links to the pages you visit the most (helpful as you’re learning your way around) and other insights into your audience and traffic.
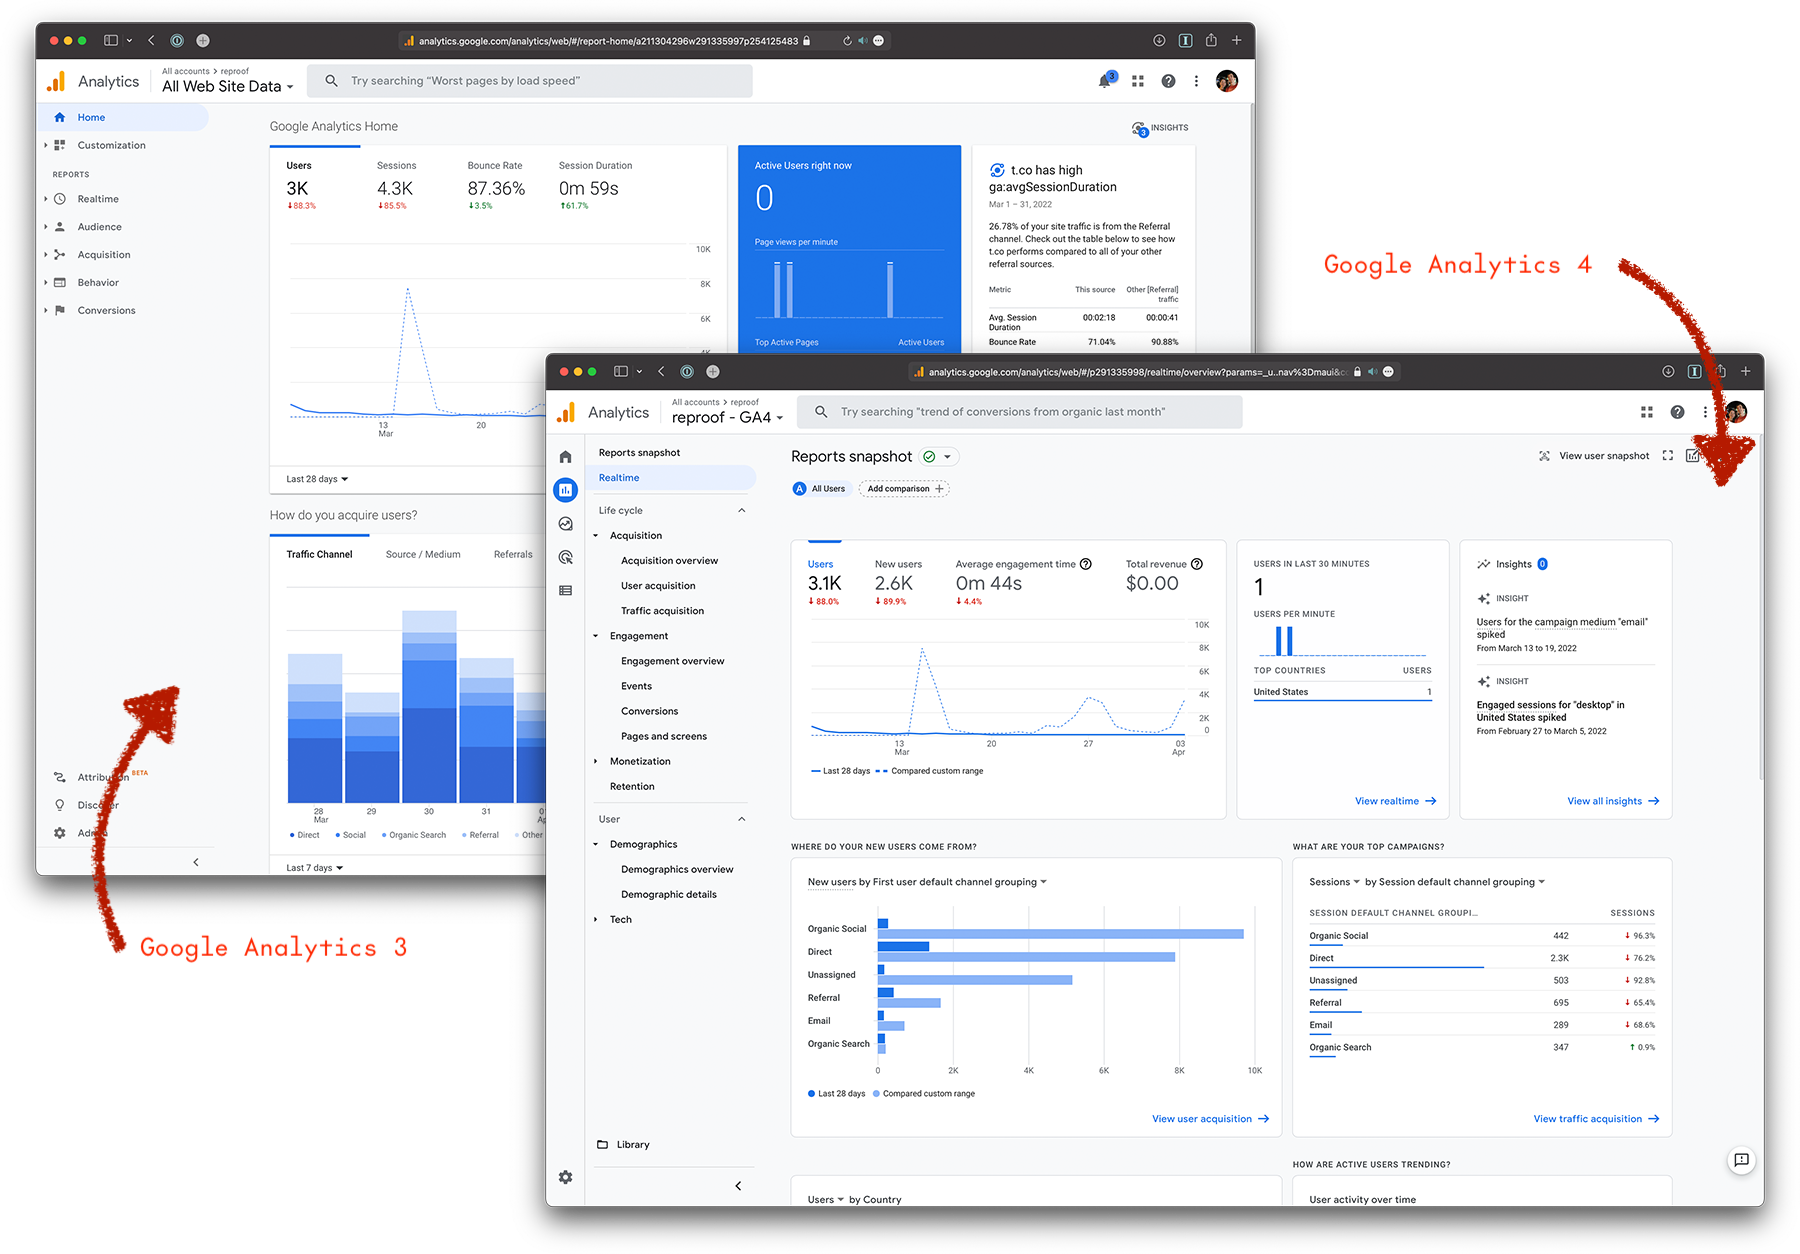
For something closer to the old Google Analytics dashboard, hover over the left sidebar menu and select Reports. That “Reports Snapshot” page looks much like the older Google Analytics Home page, showing users over the past month, active users right now, how people discovered your site, and more. This is the best place to start exploring your new Google Analytics data.
One difference between the two: Google Analytics 3's Home showed the past 7 days of data by default, whereas Google Analytics 4's Reports Snapshot shows 28 days of data. You can pick the timeframe to view in either version, though.
Realtime Audience
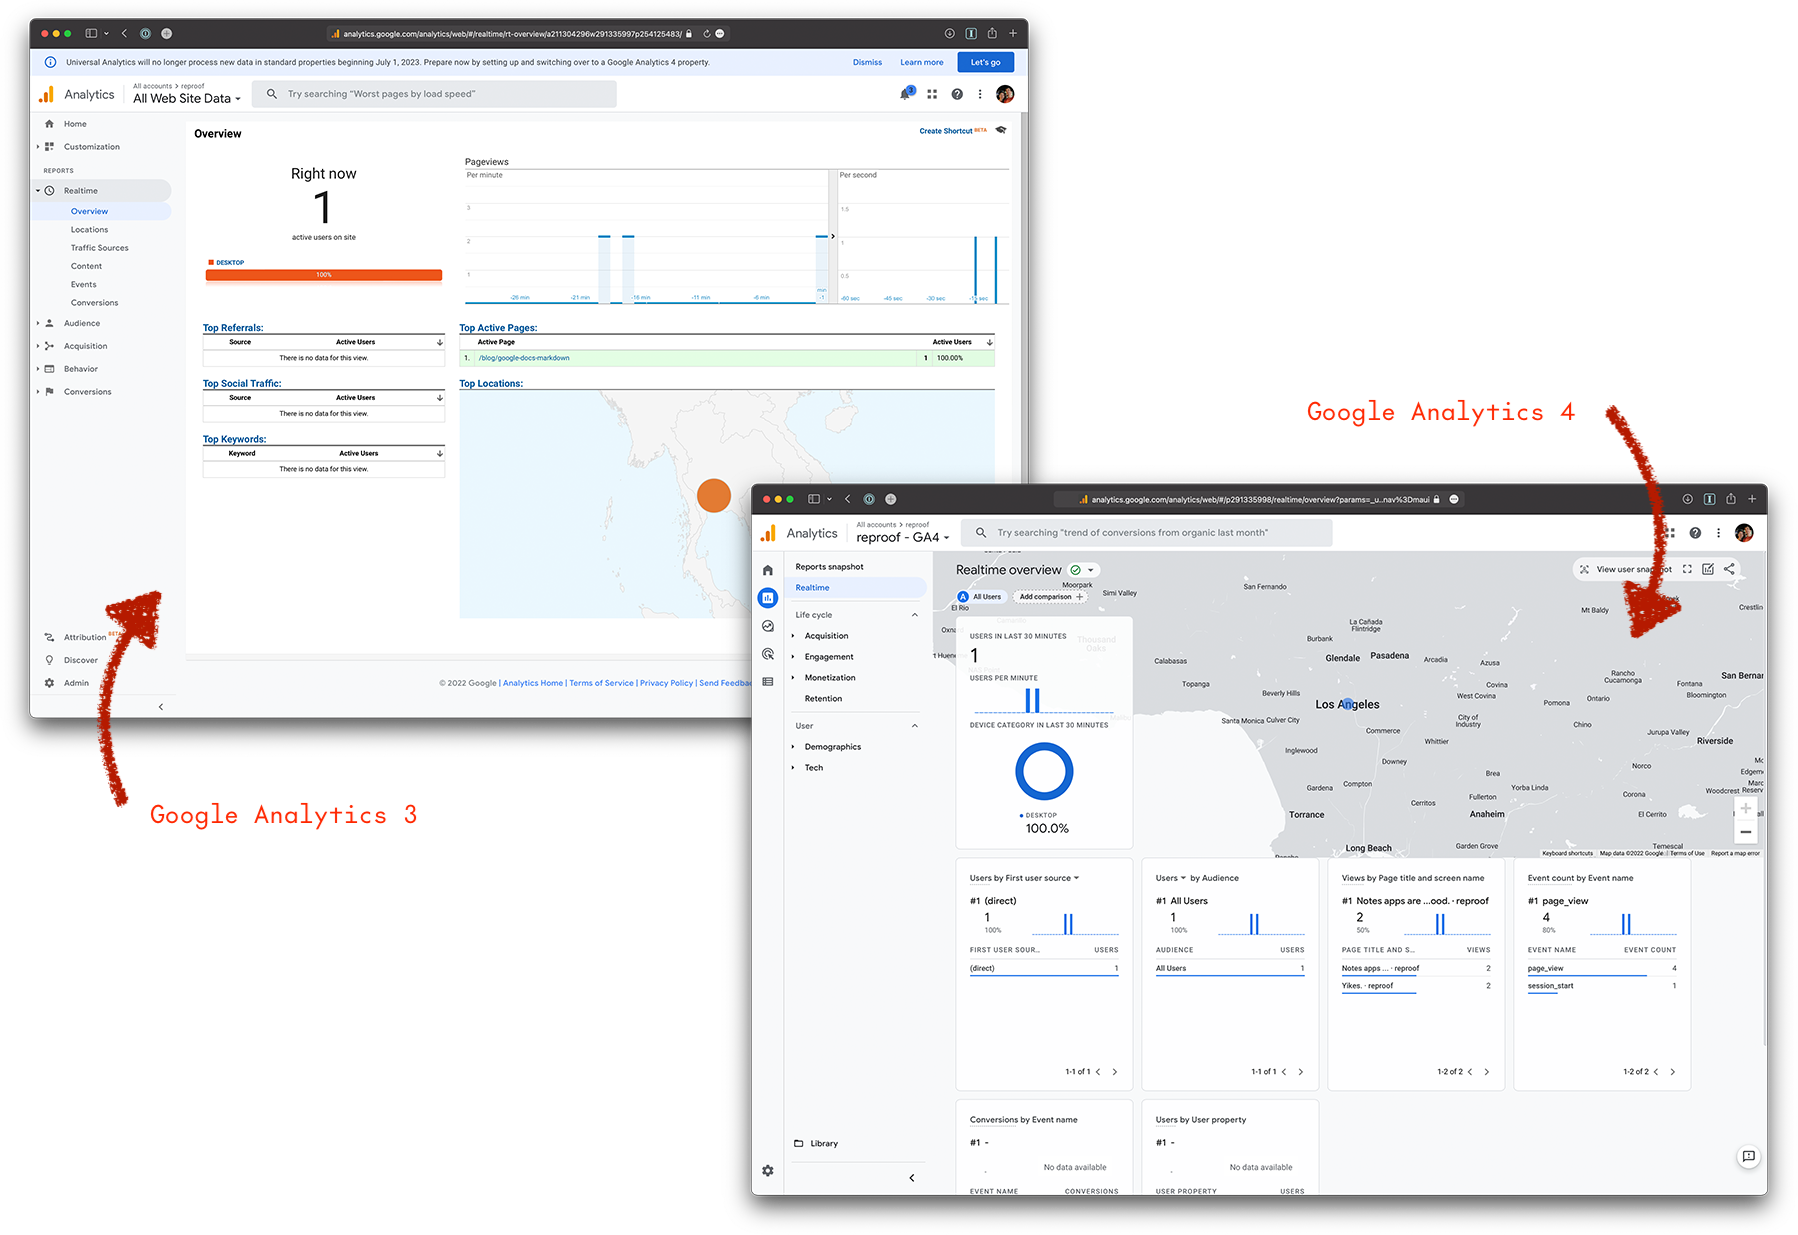
Another thing that’s similar, with a touch of fresh paint, is the Realtime Overview view. In Google Analytics 3, you’d go to Realtime → Overview to see how many people were on your site, what country they were browsing from, which website sent them to your site, what keywords they searched for to get there, and more.
In Google Analytics 4, go to Reports → Realtime for much of the same data, this time with a world map front and center. You can see which pages people are visiting, the site that sent them, and more. And, with the new focus on user activity, you can see a user snapshot to dig into what people are doing on your site, step-by-step, to see if, say, that viral article is driving sales, too.
Realtime search data is gone, though; you’ll need to jump through some hoops to get search data back, as we’ll dig into below.
Site Content → All Pages
And then, almost everything else has changed.
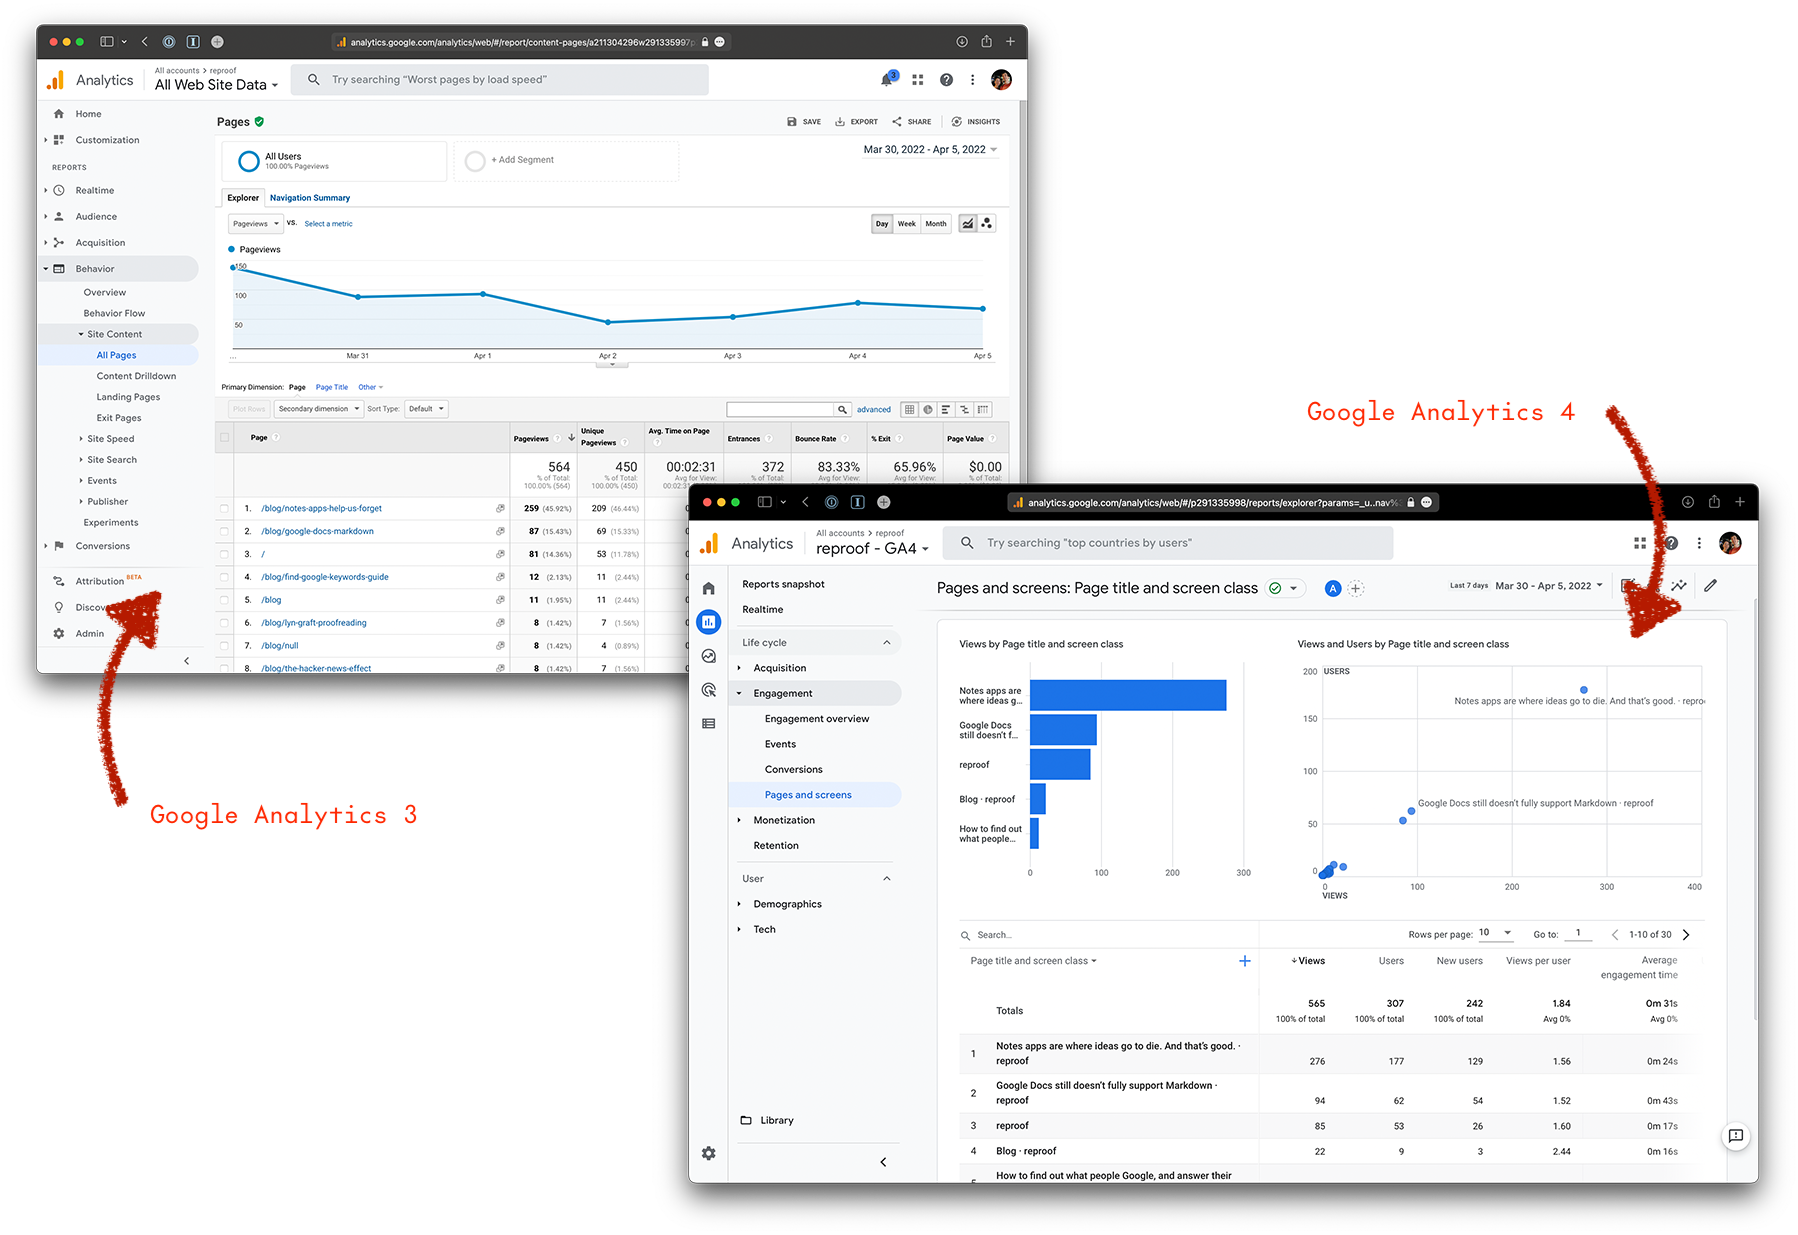
The one page I’d check the most in Google Analytics 3 was the All Pages traffic view, which you’d find by clicking Behavior → Site Content → All Pages. That page is gone, along with the entire Behavior and Site Content menu.
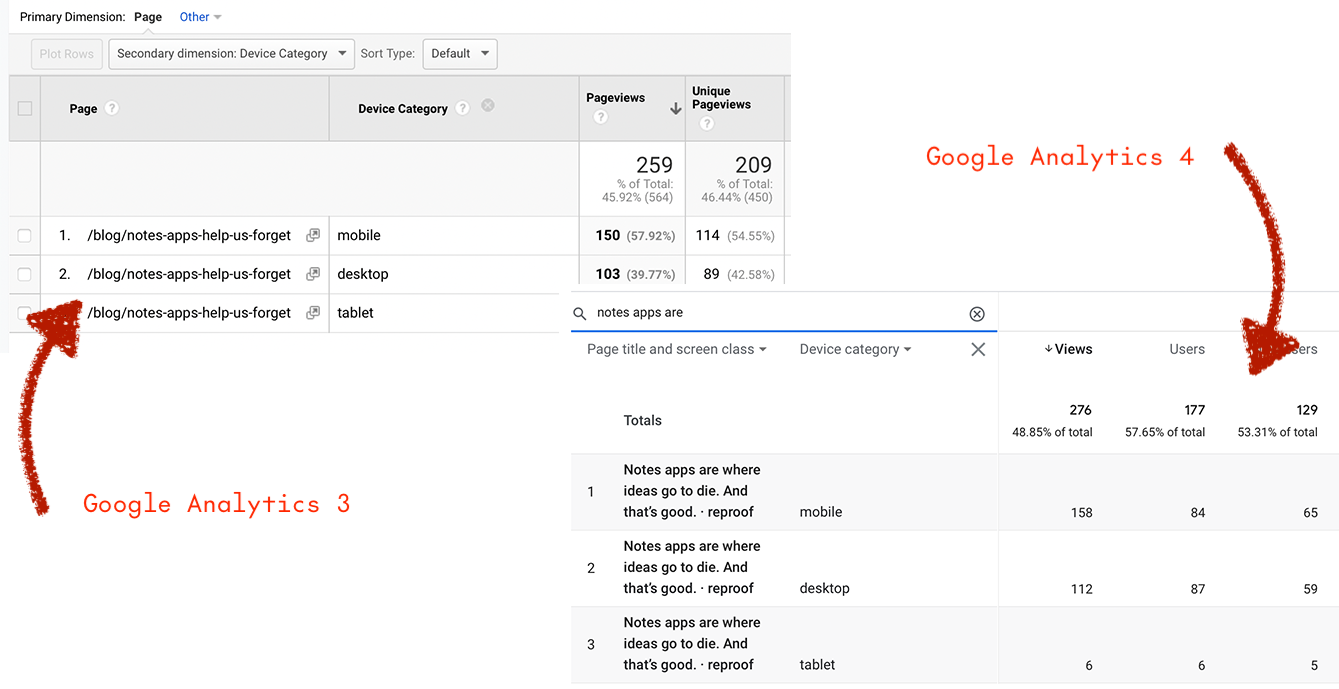
The good news is there’s a new page that’s almost the same: The Reports → Engagement → Pages and screens view. That shows your site’s traffic and most popular pages, much like the older Site Content → All Pages view did.
Only, it’s not quite the same. The terms are different; Pageviews are now Views and Unique Pageviews are approximated by Users. You’ll see the page title instead of the exact page permalink, and secondary dimensions are changed. The graph of pageviews is replaced by a scatter plot of your most popular pages. And bounce Rate is gone.
Let’s bring back those features one at a time.
Drill down with secondary dimensions
If you wanted to dig into your pageview data in Google Analytics 3, you’d add Secondary dimensions to see, say, how much of the traffic was browsing on mobile or came in from a specific campaign.
Most of that data is in Google Analytics 4, behind the + button at the top of your Pages and screens table. Click that to add another bit of data to split out your stats.
Search is still there as well, though by default it’ll only let you search for page names. If you want to search through page paths as in the older Google Analytics, click the faint Page title and screen class menu at the top of the table, and select Page path + query string instead for a more familiar and precise view.
Get a graph of your site’s traffic again
Then, there are two ways to get your traffic line graph back again. The first and easiest will show a line graph of each of your most popular pages’ traffic, right on the Pages and screens view. The second will let you build a new report with a graph that’s closer to the traffic graph from Google Analytics 3.
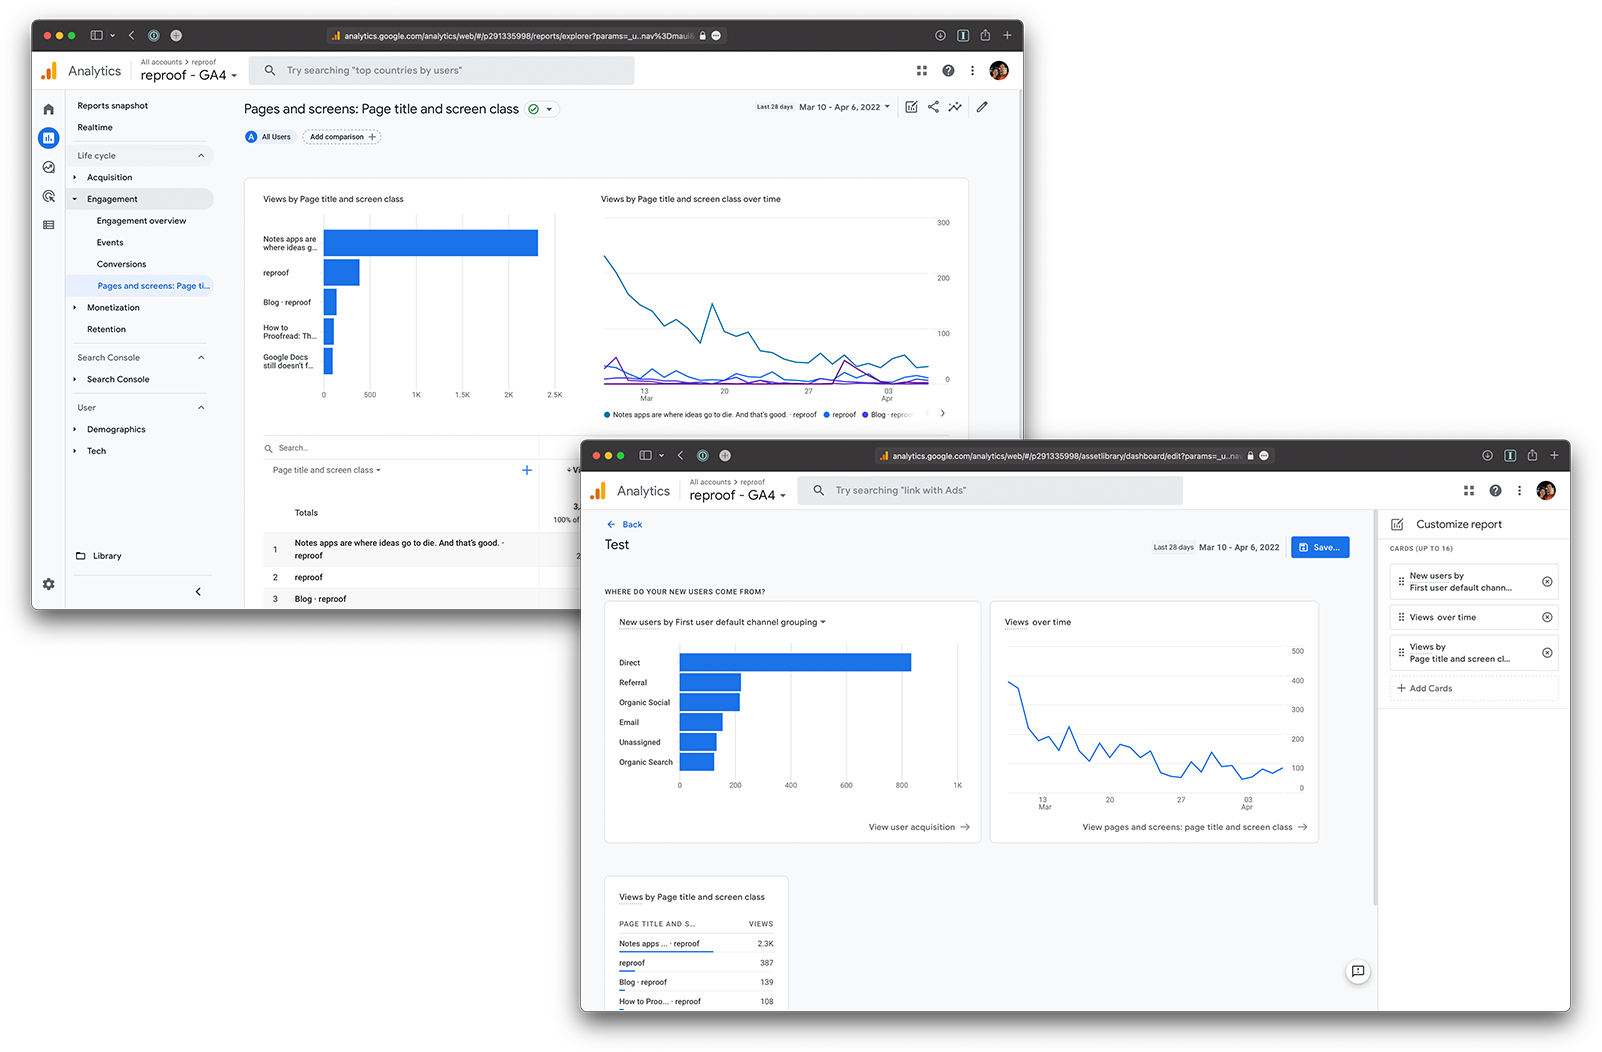
For the first option, open the Pages and screens view as above, and click the pencil button in the top right to customize the report. There, click the arrow on the second Chart widget that should read “Scatter chart,” and there select the “Line chart” option instead. Save your changes—first on the bottom of the sidebar, then at the top of the main customization screen, and now whenever you open the Pages and screens view you’ll see a line graph of all your most popular articles' individual traffic over the past few days.
For a single line that shows all of your site’s traffic together, though, you’ll need to dig in a bit more and explore Google Analytics 4’s new report building features. You’ll make a new card, publish it to a library collection, then add it to a new report.
First, open Pages and screens view again, click the pencil button to customize, and this time near the bottom of the sidebar select Create new card. Tap + Add Metrics, select Views (the new pageviews replacement), then click the line chart button. You’ll get a quick preview of this new widget that should look pretty similar to your site’s traffic in GA3. Click Apply, then save the changes to your dashboard.
You won’t be able to see that card on your Pages and screens dashboard, though; you’ll need to make a collection to publish the card, then make a new dashboard, and add the card to it. For that, head to the Library in the lower left sidebar, and click Create new collection. Select “Blank”, add a new topic (you can call it anything you want), then drag in your “Pages and screens” page from the Detail Reports box on the right. Save your new collection.
Finally, click + Create new report, choose “Create overview report,” click +Add cards, select your new “Views over time” card, and click Add card to add it to your dashboard. You can add other cards to put more data together if you want—but there’s no way to get your line chart along with a list of articles, so you’ll always need to use this new dashboard alongside the Pages and screens view.
Once you’re done, save the report, then you can come back to the Library and view it anytime you want to see a chart of your site’s traffic in a single line.
This is actually where you might decide to like Google Analytics 4. The new cards and tools to turn them into dashboards are nice—though it does feel like there could be a few fewer steps in the process. But with a bit of trial and error, you can likely build boards that show most of the things you need to check regularly in one place.
Bounce Rate
That brings us back to the Bounce Rate, one bit of data that’s gone for good in Google Analytics 4. Bounce Rate previously tracked “the percentage of single-page sessions in which there was no interaction with the page,” according to Google.
Google Analytics 4 now includes a new Engagement Rate, instead, which tracks “the percentage of engaged sessions,” where Engaged Sessions are “the number of sessions that lasted longer than 10 seconds, or had a conversion event, or had 2 or more screen or page views.” So, generally, your Engagement Rate should be somewhat higher than your non-Bounce Rate. For example, Google Analytics 3 shows an 86.53% Bounce Rate on a page for my site, whereas that same page shows an engagement rate of 28.85%.
So if you want to compare your Engagement Rate today with your site’s historic Bounce Rate, subtract your Engagement Rate from 100% to get something directionally similar.
But first, you’ll need to get the new Engagement Rate to show up. To do that, go back to the Reports → Engagement → Pages and Screens view, click the pencil to customize the report, tap Metrics in the top of the right sidebar, and click +Add Metric. Now select the Engagement Rate, and drag it to the order you want in your metrics list. Save the changes, and now whenever you open Pages and Screens, you’ll see the percent of readers that were engaged—or who read for at least 10 seconds or clicked to at least one other page.
Referrals
To a degree, all metrics are vanity metrics—and perhaps, in a way, that’s the negative take on all of this, that it doesn’t really matter. But when you’re writing, it’s nice to know when people read your stuff, helpful to know what didn’t resonate as well, and encouraging to know when other sites link to your work.
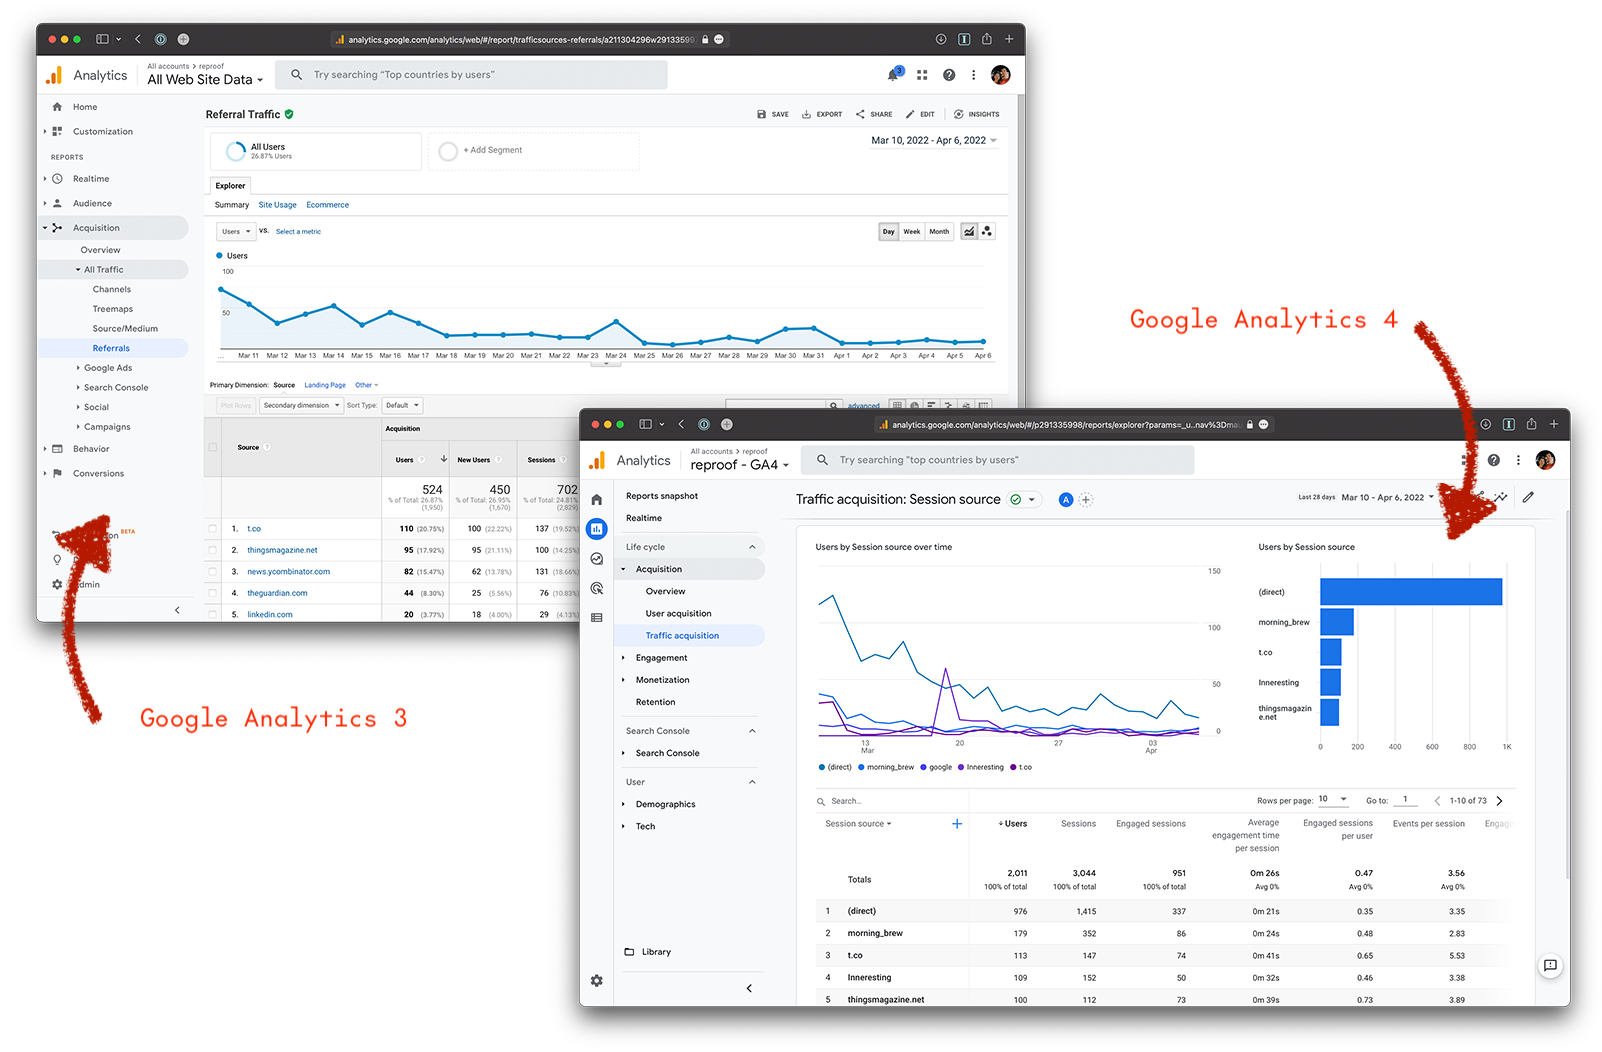
That’s where Referrals come in. They’re where Google Analytics let you know that someone linked to what you wrote. In Google Analytics 3, you’d go to Acquisition → All Traffic → Referrals, and could see which sites linked to your blog. Click the core site name, and you could drill down and find the exact page that linked to your site.
You can still see referrals in Google Analytics 4, only now, you can only see the sites that link to your site, not the specific pages. Go to Reports → Acquisition → Traffic acquisition to see an overview of where your traffic comes from. By default, that will show your direct, referral, social, email, and search traffic. To see the sites that sent you referral traffic, click the faint Session default channel grouping menu at the top of the list, and select Session source instead. That will then show each domain that’s linked to your site, as above.
And, as an extra tip, that's also where you'll find Campaign data in the new Google Analytics. In that dropdown, select Session Campaign instead to see how much traffic your campaigns sent to your site, or Medium to see if your newsletter sent more traffic than search, and so on.
So now you know the sites that are sending you traffic—but want to see the exact page that mentioned your site? You’ll need to switch over to Google’s Search Console instead. There, click Links in the lower left sidebar, then click the More button on the Top Linked Pages widget. You can then see each page on your site with backlinks; click the page you’re interested in to see which sites link to it, then click again to see the specific pages that linked to your site. It’s as detailed of data as you could have gotten in Google Analytics 3, only here grouped by the pages on your site rather than by the sites that linked, and without a way to filter the data by time. You’d need something like Ahrefs for more detailed data—but this is enough to at least replace what you could have gotten in Google Analytics 3.
Search Queries
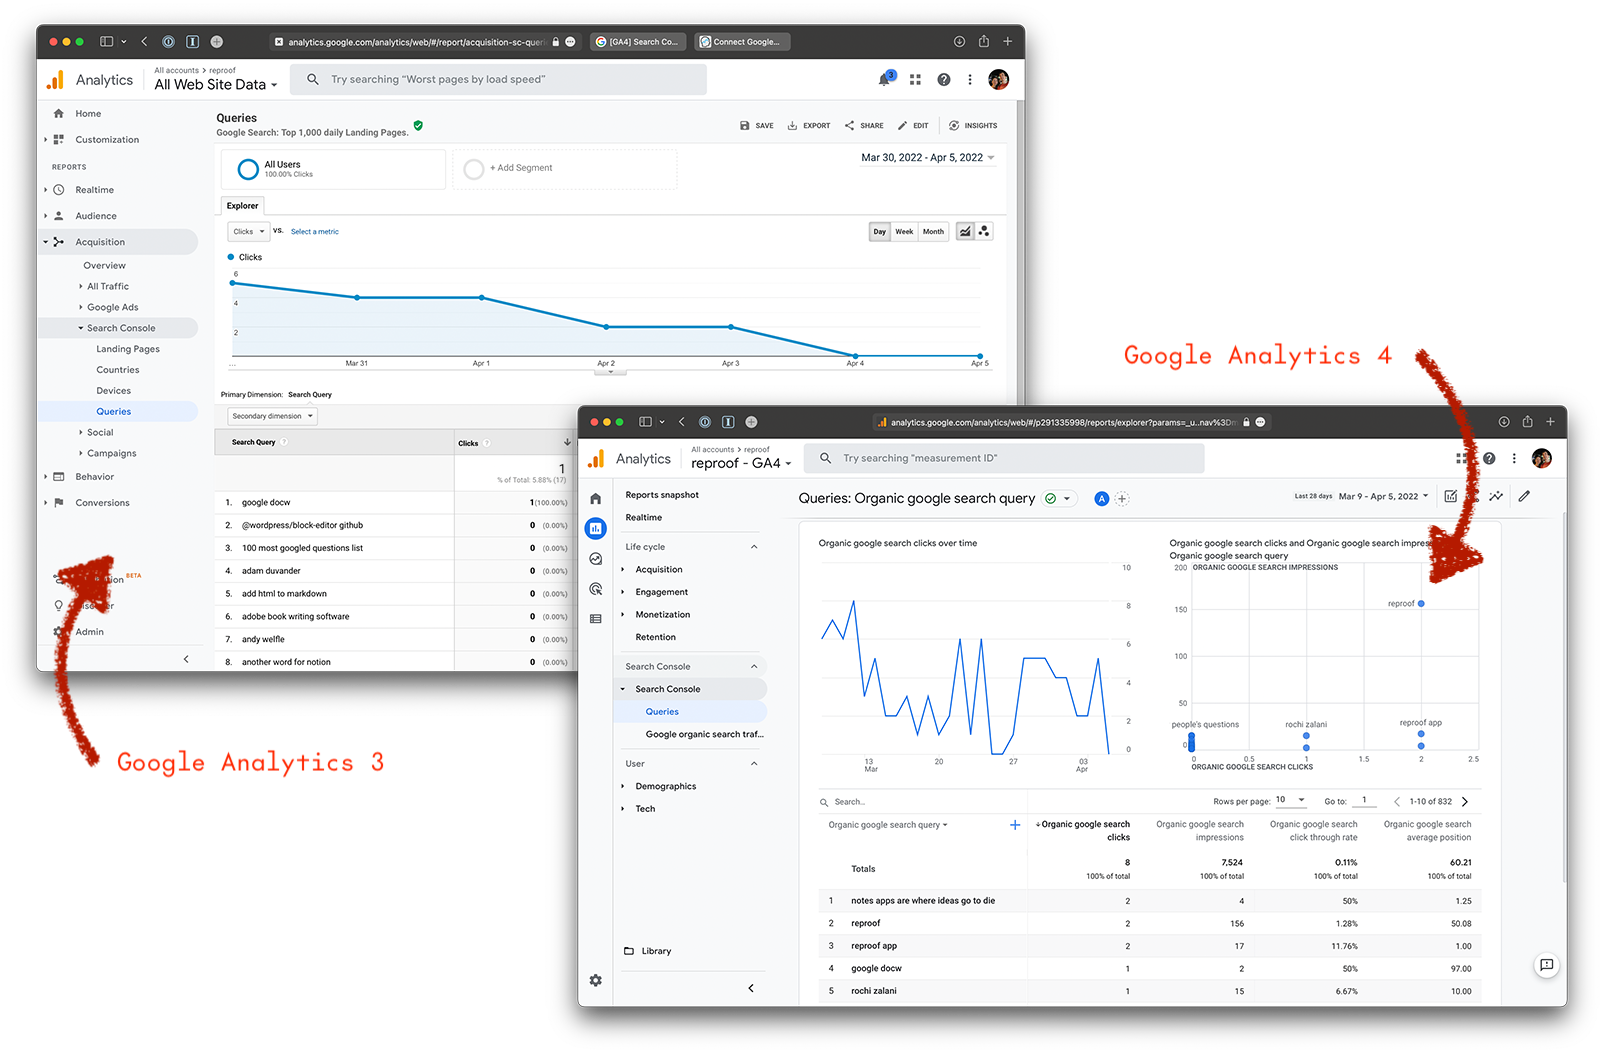
Speaking of Google Search Console, you’ll need that account to bring back another Google Analytics 3 feature: Search Console → Queries.
Google Analytics 3 showed what people searched to find your site, based on data from Google Search Console. You can get that same data in Google Analytics 4, but it takes a few more steps to activate it.
In Google Analytics 4, first click the Gear icon in the lower-left to open your Admin settings. Click Search Console Link in the lower right column, and connect your Search Console account to Google Analytics.
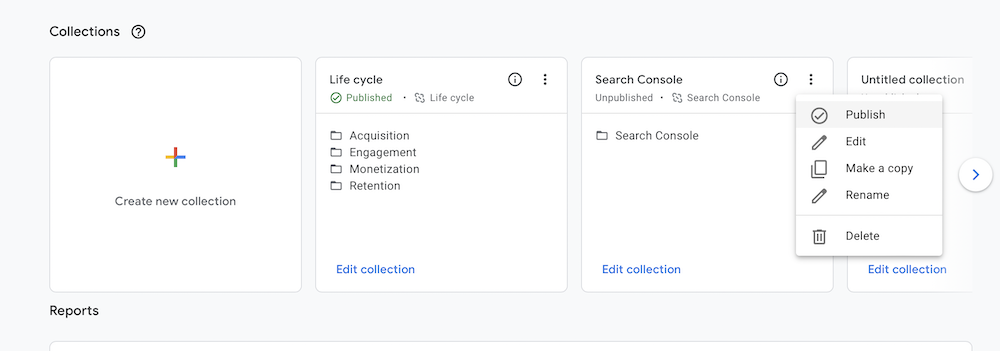
Now you have to activate it. Go back to the Reports tab, open the Library, and there you’ll find a new Search Console collection that’s unpublished by default. Click its 3-dot menu, select Publish, and then you’ll see a new Search Console tab show up in the list of Reports on the top left of the page. And that will bring back the full search data that you’re used to seeing in Google Analytics 3—it just took a bit more work to get it up and running.
And then you keep exploring
That's how you get the standard blog-focused features from Google Analytics 3 back in the new Google Analytics 4. Once you've dug in that much, you'll start remembering your way around, start finding new things you could dig into with the new data. The cards and reports could let you make a one-stop page to check all the most important things about your site; the new graphs could help you picture how your site's content comes together better than before. And you might even find the event-driven tracking to be helpful, as you start to think about how many people stick around instead of how many bounce, and what other actions they take as they move around your site.
Or you might still just want to check the old classic Site Content → All Pages page ... and for that, just bookmark the new Reports → Engagement → Pages and Screens to see which of your posts are bringing in the most readers.
And then, back to writing. Stats are good, but you've got to keep writing and publishing to find what'll truly resonate with and grow your audience.